Visualizations
Oríon provides several plotting helpers to support visual analysis of hyperparameter optimization runs. These tools will help you:
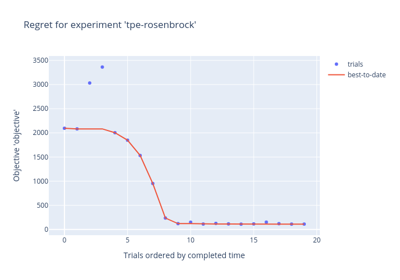
Examine the optimization curve (regret plot),
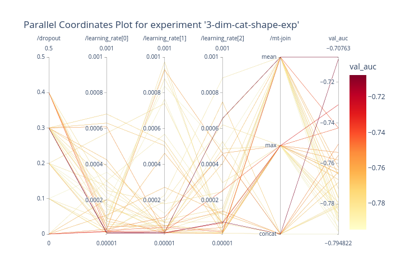
Find trends for best hyperparemeters in search spaces with many dimensions (parallel coordinates)
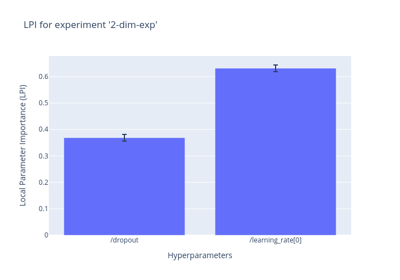
Assess which hyperparameters were most important globally (local parameter importance)
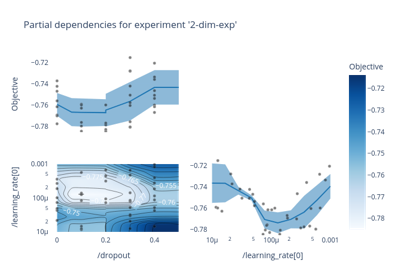
Dissect the search space in slices to observe dependencies across dimensions (partial dependencies).
Examples
Detailed examples of the different type of visualizations, how to use and interpret them.
How-tos
Examples to show-case different ways to create, save and share the visualizations.


